FS2000 Core Module

- Static Analysis - All linear element types
- P-Delta and simple contact - non-linear capability
- Frequency Analysis (Vibration modes)
- Linear Buckling (Eigen buckling modes)
Optional analysis modules and post-analysis design modules provide additional capability (non-linear, design checkers etc).
The core module is available in two size versions each limited by a maximum element label, these are 1500E and 32000E.
The demo version provides the core module capability but with the element number limited to 20 elements.
General Features
FS2000 has been developed with the objectives of producing an analysis system that is interactive and graphically orientated. Model generation and load definition can be driven from text based commands since all definition data is in the form of text files but the interactive/graphical approach is far more effective in all respects. Virtually all definition data can be shown graphically, this includes dimensioning, properties, effective length data, loads etc. By using Saved Views all definition data can be reproduced graphically on paper in the same manner in which it was defined. Using Saved Views and conventional tabular output the process of model definition and model QA be can extremely thorough and efficient.
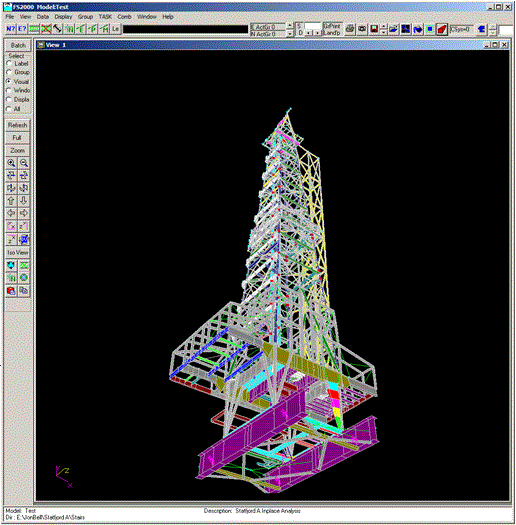
A view showing the FS2000 Window interface.
Model Definition Model geometry, loading and design check parameters can be defined in a 3D interactive graphical environment or can be defined using an interpreted text file containing command line instructions. Both modes of definition can be simultaneously used without the loss of comment lines.
Graphical Data Checking Virtually all definition data can be shown graphically, this includes properties, loading values, effective lengths etc. Views may even be dimensioned. This enables all model QA checks to be done in the same manner that the model is created i.e. graphically.
Groups Groups may be used to provide a powerful secondary numbering system for nodes or elements. Groups can be used as a selection and sort option in virtually all aspects of model manipulation and output. This feature is considered an absolute essential for the efficient control of large models.
Saved Views Model plots may be saved and recovered. The save views are not simply graphical images but view settings which always reflect the current state of the model when re-played. The saved views are not restricted to definition plots but may also include results plots e.g. utilisation plots or stress contour plots. Static graphical images (BMP & WMF) can also be created.
Batch Processing In addition to using the interactive menus to control the analysis process the process can be controlled using command line instructions in a text batch control file. The batch control file can be formed by using batch emulation buttons on the interactive Windows input forms. These convert the form settings to command line switches which are then appended to the batch file. By emulating the interactive process in a batch file future runs can be completely automated. See more of Batch Processing
Multiple Model Configurations Model generation commands may be interpreted during a batch processing. This allows the user to change the model during an analysis run e.g. members added/deleted/re-orientated, restraints changed etc.
Multiple Reports Using Sub-Cases any number of separate results reports can be created for a single results case. Typically one could be created for selected nodal deflection and one for selected member joint loads. Separate structural and pipework design reports can also be created for the same results case. Sub-Case reports which can also be applied to formatted definition data provide a high degree of selectivity which enable the user to create concise final reports without having to include all results data.
Report Collation When output is required to be printed the Report Collation utility may be used to organise final printed reports. This utility can be used to automatically form a final printed report by collecting all formatted output data (definition and results). Data may also be selected individually by the user. Multiple reports can be created which enable the user to create final printed reports of a concise nature.
